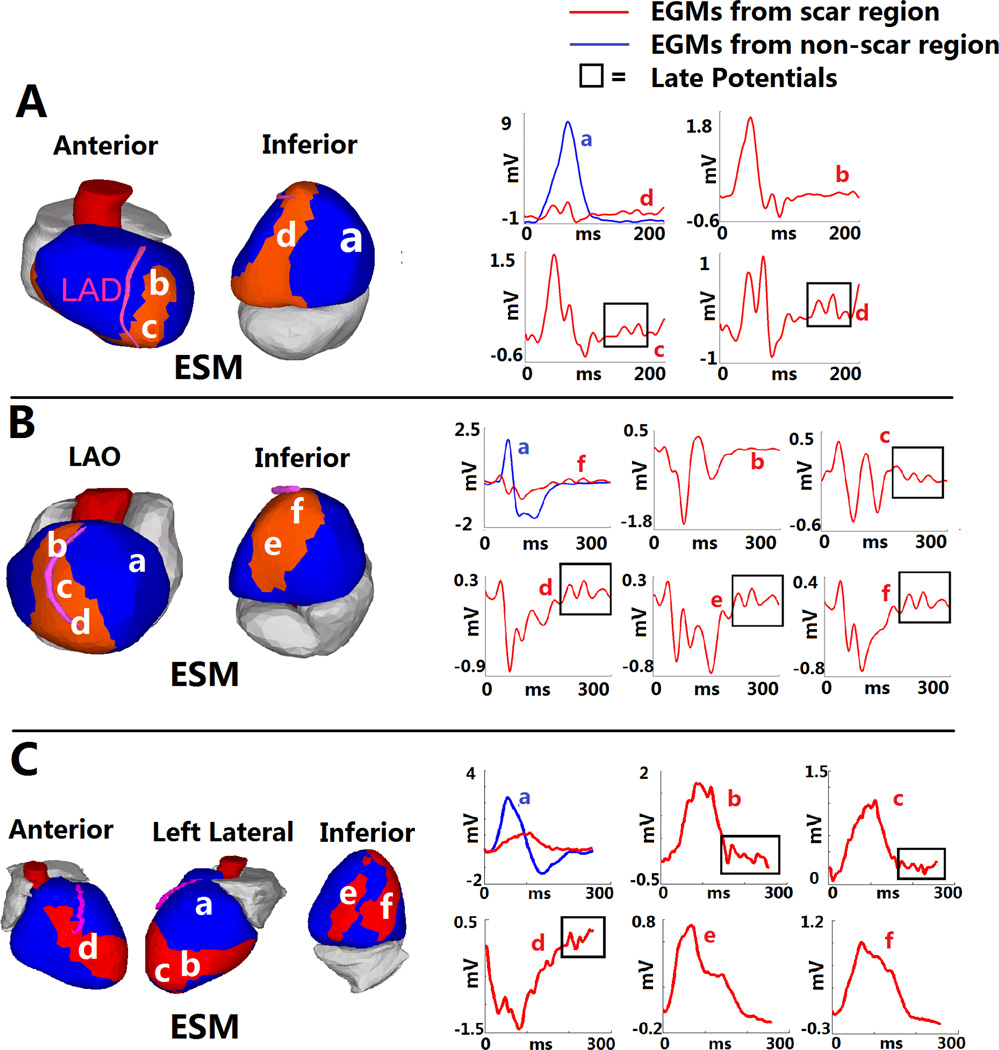
Figure 6.
Late Potentials within Electrical Scar. A: ESM from a patient with inferoapical scar. Three EGMs from the scar are shown on the right (b,c and d; red). Scar EGM d is also shown together with non-scar EGM a (blue) in the upper left panel, to highlight differences. EGMs c and d demonstrate late deflections (“late potentials”) (box). LPs were observed almost exclusively within electrical scar. However (EGM b), LPs were not present in all scar regions. B: Anteroapical infarct. LPs are present in EGMs from inferior and apical regions (c–f), but not the anterior region (b). C: Complex anterior, apical and inferior infarction. LPs are present in several EGMs from the anterior and apical regions (b–d), but not the inferior region (e,f).

