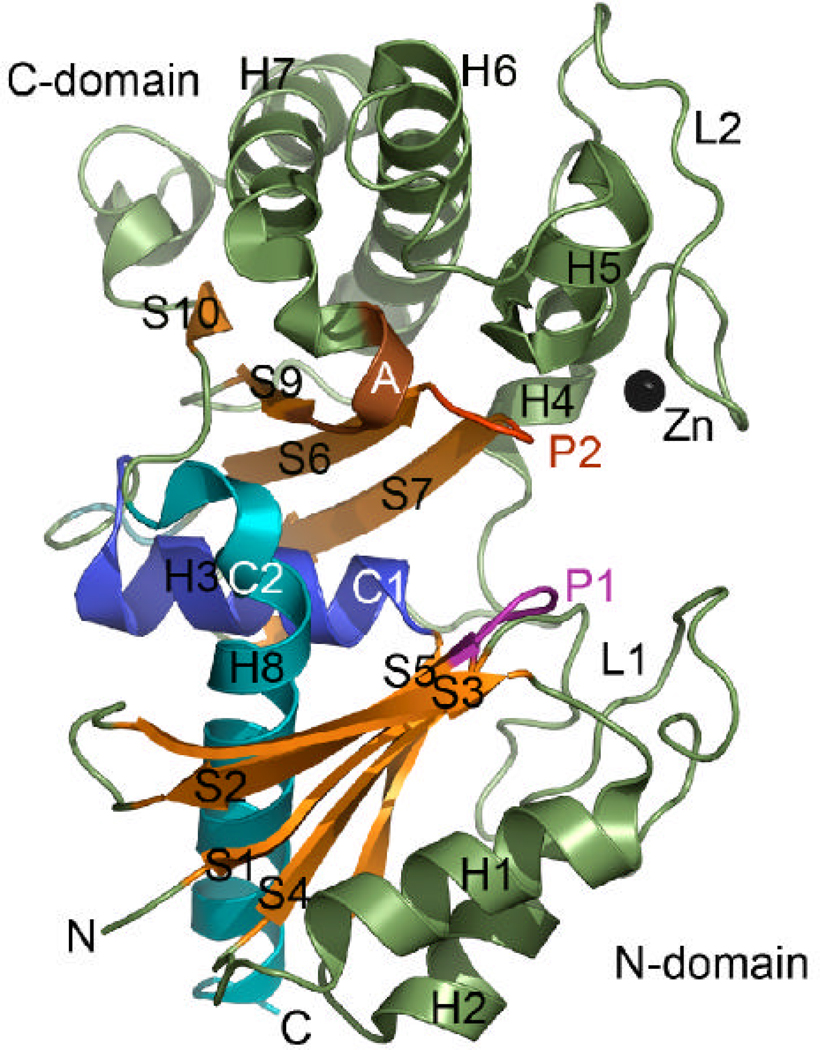
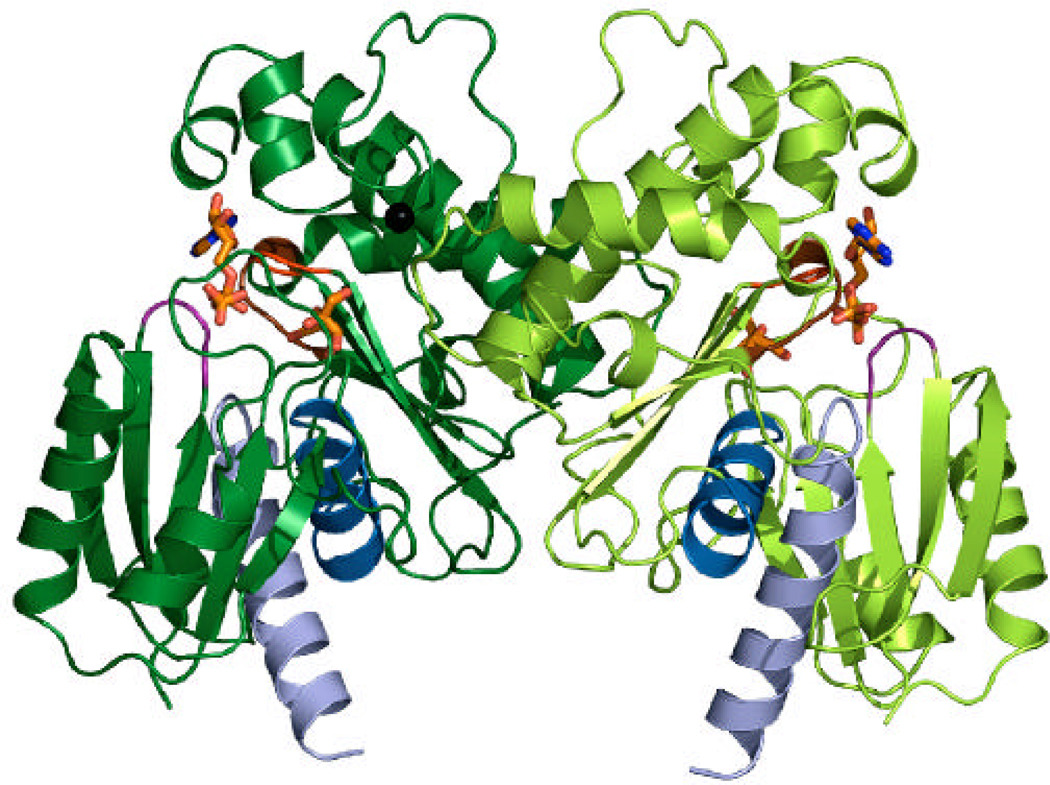
Figure 3.
Crystal structure of YdhR.
A) A ribbon representation of the YdhR structure (β-strands are depicted in orange, helices in green, zinc ion in black). Secondary structure elements are indicated with H (helices) and S (strands). The YdhR fold shows homology to that of actin/hexokinase/HSP70 ATPase domains, with the common structural segments labeled and mapped on the three-dimensional structure of YdhR (P1, phosphate 1 region in magenta; P2, phosphate 2 region in red; A, adenosine region in brown; C1, connect 1 helix in blue and C2, connect 2 helix in cyan).
B) A ribbon representation of the YdhR dimer with bound ADP and fructose shown as sticks in orange, blue, and red. Zinc ions are shown as black spheres.


