
Figure 4.
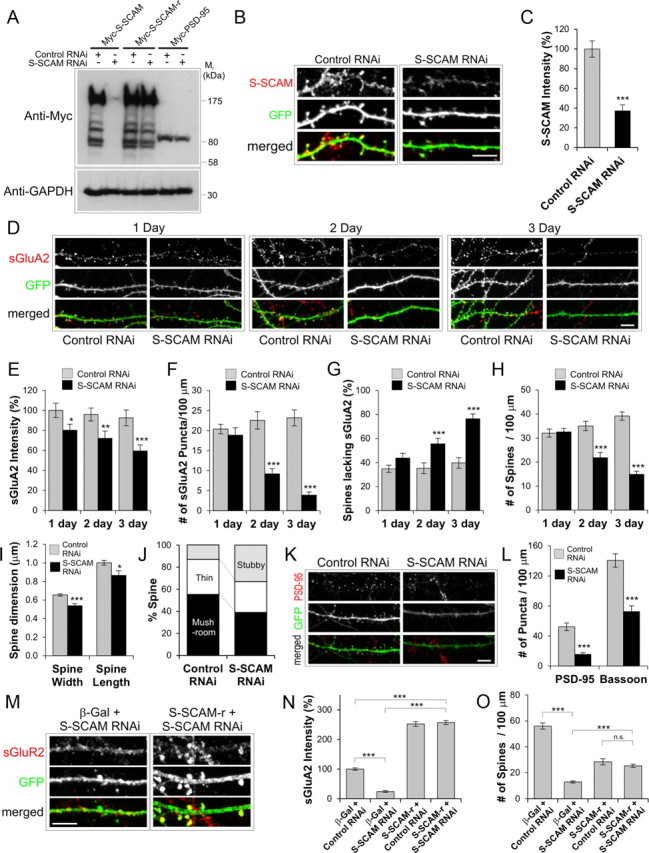
S-SCAM knockdown by RNAi reduces surface AMPARs and led to the loss of dendritic spines. A–C, Specificity and efficacy of S-SCAM RNAi. A, COS cells were cotransfected with myc-S-SCAM, myc-S-CAM-r (RNAi-resistant S-SCAM), or myc-PSD-95 and S-SCAM RNAi or control RNAi (Zn-T3 RNAi). Note that S-SCAM RNAi reduced S-SCAM levels but had no significant effect on the S-SCAM-r and Myc-PSD-95. Anti-GAPDH blot is shown as a loading control. B, C, Efficient knockdown of endogenous S-SCAM by S-SCAM RNAi in hippocampal neurons. GFP (green) was coexpressed from the RNAi expression plasmid and used as transfection marker. Representative images are shown in B, and quantification of data are provided in C. D, Represents images showing the time course of S-SCAM RNAi effect on sGluA2 (red) levels. E–J, Quantification of the effect of S-SCAM RNAi on sGluA2 intensity (E), the density of sGluA2 puncta (F), percentage of dendritic spines lacking sGluA2 staining (G), dendritic spine density (H), dendritic spine dimension (I), and dendritic spine morphology (J). K, L, Effect of S-SCAM RNAi on PSD-95 and Bassoon clusters (red). Representative results are shown in K. Quantification of the S-SCAM RNAi effect on the density of PSD-95 and Bassoon clusters is shown in L. M–O, Rescue experiments with S-SCAM-r. Representative images of neurons cotransfected with S-SCAM RNAi and S-SCAM-r stained for sGluA2 and GFP (M). Quantification of the rescue experiments for sGluA2 intensity (N) and dendritic spine density (O). n > 25 per condition. ***p < 0.001, **p < 0.01, *p < 0.05. Scale bar, 5 μm.