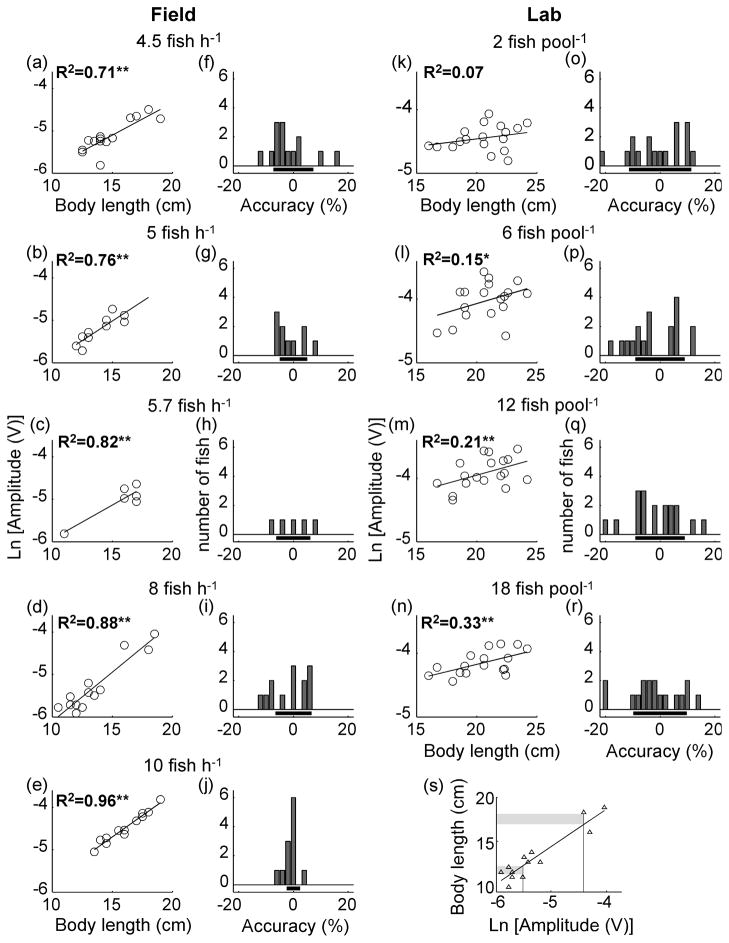
Figure 3.
Signal amplitude becomes a more accurate predictor of body length as population density increases, both in the field and the lab. Scatter plots and linear regressions show relationships between body length and the natural logarithm of signal amplitude, both in the field (a–e), and in the lab (k–n). All regressions in the field were statistically significant (a: p=0.0002, n=14; b: p=0.001, n=10; c: p=0.013, n=6; d: p<0.0001, n=13;e: p<0.0001, n=12). In the lab, only the highest two density treatments produced statistically significant relationships between signal amplitude and body length (k: p=0.3, n=18; l: p=0.10, n=18; m: p=0.05, n=18; n: p=0.01, n=17). Single asterisks denote marginally significant regressions (p≤0.1) and double asterisks denote significant regressions (p≤0.05). Bar plots show the accuracy of EOD amplitude as a predictor of body length in the field (f–j), and in the lab (o–r). The x axis values represent the accuracy of EOD amplitude predicting body length, calculated from the residuals of the regression between ln[EOD amplitude] and body length (s), as a percentage of body length. The height of the bars indicate the number of fish whose length can be predicted from the EOD at a given accuracy level. Horizontal bars indicate ± standard deviation of the accuracy of EOD amplitude predicting body length. Note that the accuracy of EOD amplitude as a predictor of body length was within 2.4 % of the fish’s actual body length (j) for the highest population density in the field (e).

