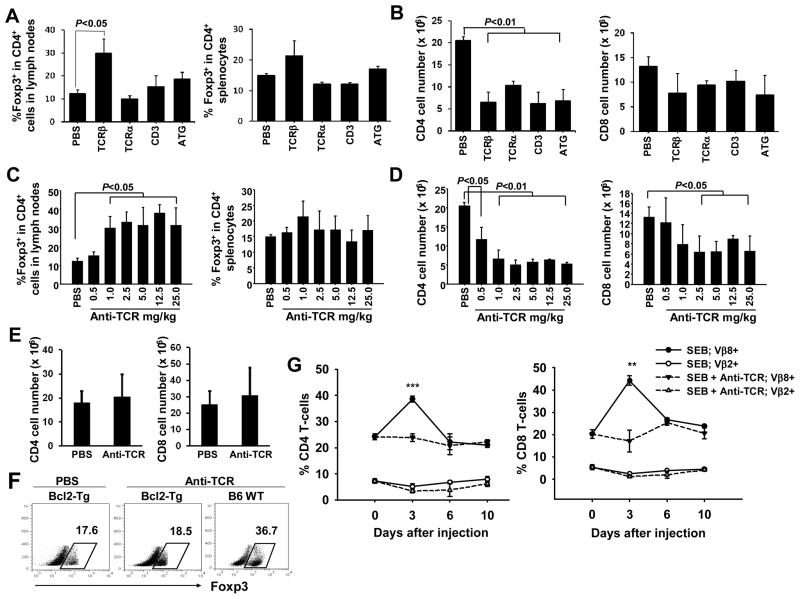
Figure 1. H57-597 mAb enriches Treg cells and arrests T-cell response to SEB.
(A–D) In A & B, B6 mice were injected once with either PBS, indicated mAbs at 1mg/kg, or ATG at 5mg/kg. In C & D, B6 mice were injected with increasing doses of H57-597 mAb as indicated. Five days later, cells were isolated from the secondary lymphoid organs for ex vivo analysis. In A & C, bar graphs show the frequencies of FoxP3+ cells among the CD4 cell population in lymph nodes (left panel) and spleens (right panel). In B & D, bar graphs show the number of CD4 (left panel) or CD8 (right panel) cells in spleens. (E) Bcl-2 Tg or wild type B6 mice received a single injection of 1 mg/kg H57-597 mAb or PBS. Bar graphs show the number of CD4 (left panel) or CD8 (right panel) cells in spleens of Bcl-2 Tg mice treated with PBS or anti-TCRβ mAb. (F) Dot plots show the frequencies of FoxP3+ cells among CD4 cell population in spleens of Bcl-2 Tg mice treated with PBS (left panel), Bcl-2 Tg mice treated with H57-597 mAb (middle panel), and B6 treated with H57-597 mAb (right panel) mice at day 5 after injection. (G) B6 mice were injected with either 150 μg SEB alone (solid lines) or together with 1 mg/kg H57-597 mAb (dashed lines). Splenocytes were isolated at the indicated days after injection, and the frequencies of Vβ8+ and Vβ2+ among CD4 (left panel) or CD8 (right panel) cell populations are shown (** p < 0.005 and *** p < 0.0005).

