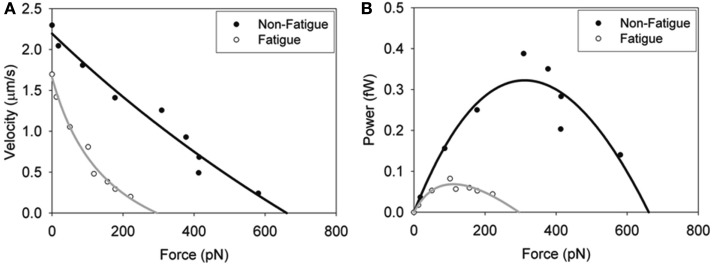
Figure 5.
In vitro force–velocity (A) and force–power (B) relationships. Fatigue was simulated by exposing the myosin pH 6.2, 30 mM Pi and 0.3 mM ADP and the effects on skeletal muscle myosin’s force–velocity relationship determined. Load was applied by adding increasing amounts of an actin-binding protein (alpha-actinin). Data were fit with the Hill force–velocity equation (Hill, 1938) with the black line normal conditions and the gray line fatigue-like conditions. The force–power relationships (B) were derived by calculating the product of force and velocity and fit to the Hill force–power equation (Hill, 1938). Figure reprinted from Greenberg and Moore (2010) with permission from John Wiley and Sons.

