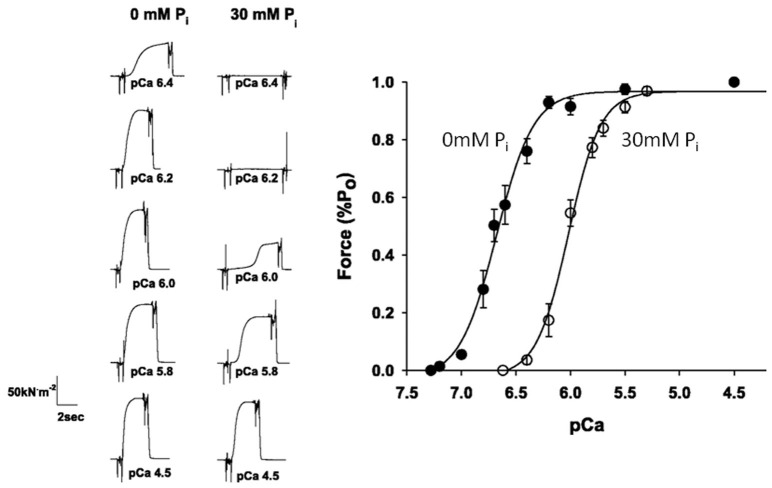
Figure 6.
Effect of Pi on the force–pCa relationship. Skinned single fiber muscle forces measured at increasing concentrations of free Ca++ (displayed in pCa, −log units) in the presence and absence of 30 mM Pi (A). The forces are normalized to the maximum reached at saturating pCa (4.5) and fit with the Hill plot (B). The leftward shift in the curve indicates that elevated Pi makes the fibers less sensitive to Ca++. Figure is modified from Debold et al. (2006), reprinted with permission from the American Physiological Society.

