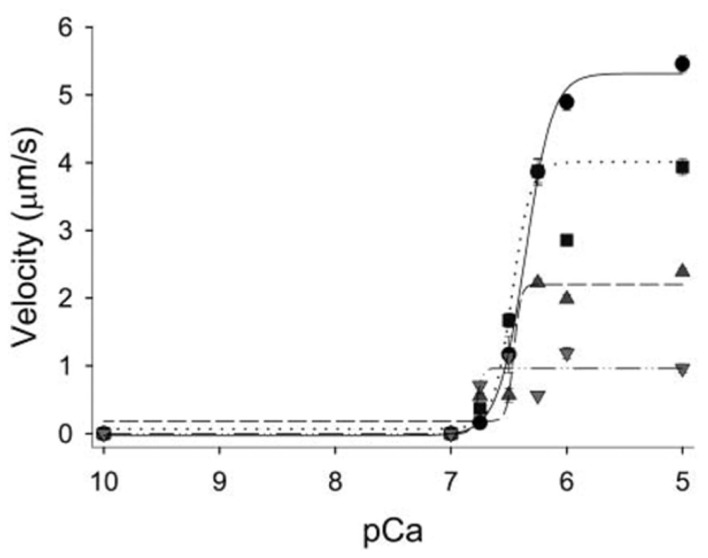
Figure 7.
Effect of ADP on the velocity–pCa relationship in vitro. Regulated actin filament velocities plotted as a function of increasing ADP concentrations. The ADP levels were increased from 0.5 mM ADP (squares, dotted line), to 2 mM (triangles up, dashed regression), and 5 mM (triangles down, dash-dot regression) and compared to control experiments with no added ADP (circles, solid regression). Elevated ADP significantly decreased maximal velocity but increased the pCa50 of the thin filament in a concentration-dependent manner. Figure modified from Gorga et al., 2003, reprinted with permission from Cell Press.

