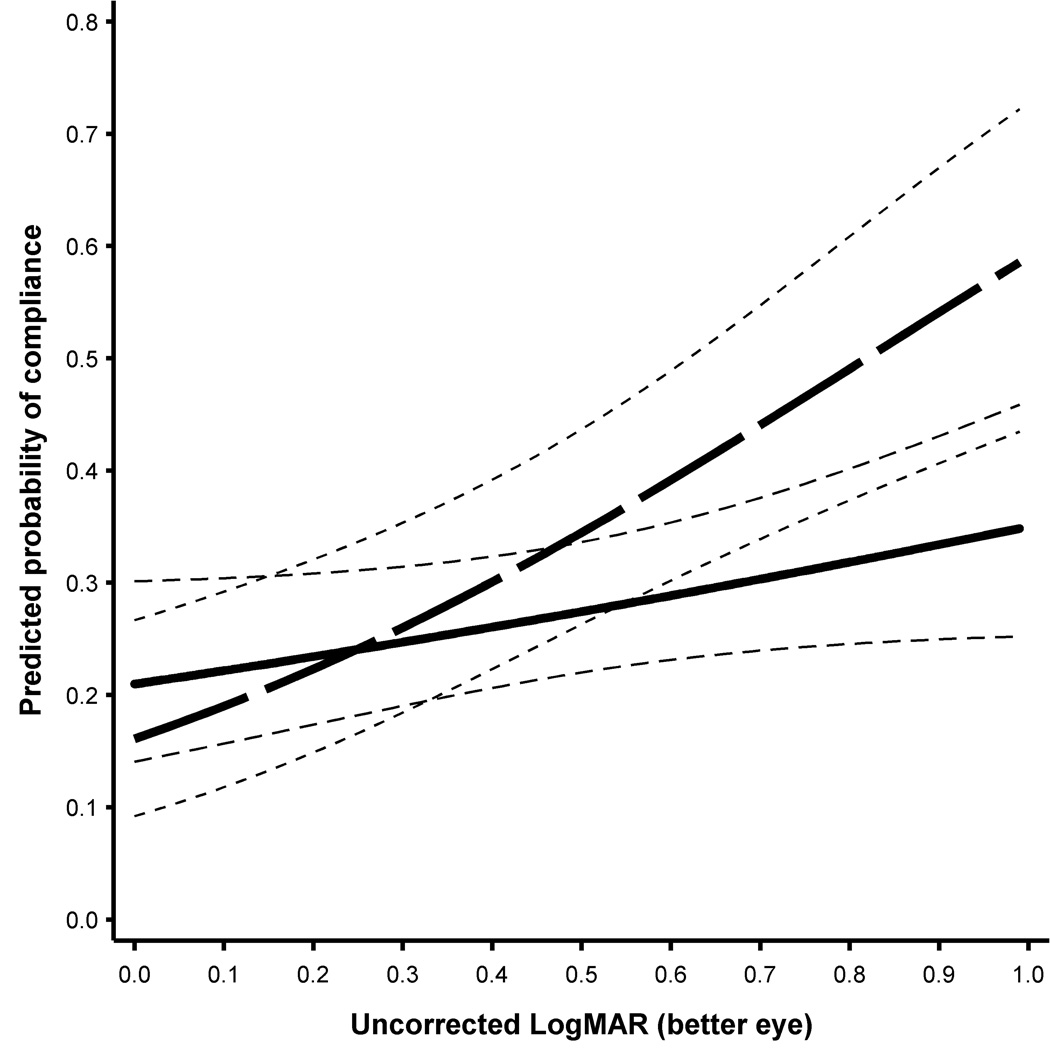
Figure 2.
Estimated chance of compliance at follow-up as a function of uncorrected logMAR VA in the better eye using the model fit with the full sample (n = 798). Bold dashed line is for the complete care model and the bold solid line is for the screening and notification model. The lighter dashed lines show the estimated 95% confidence intervals.

