
Figure 3.
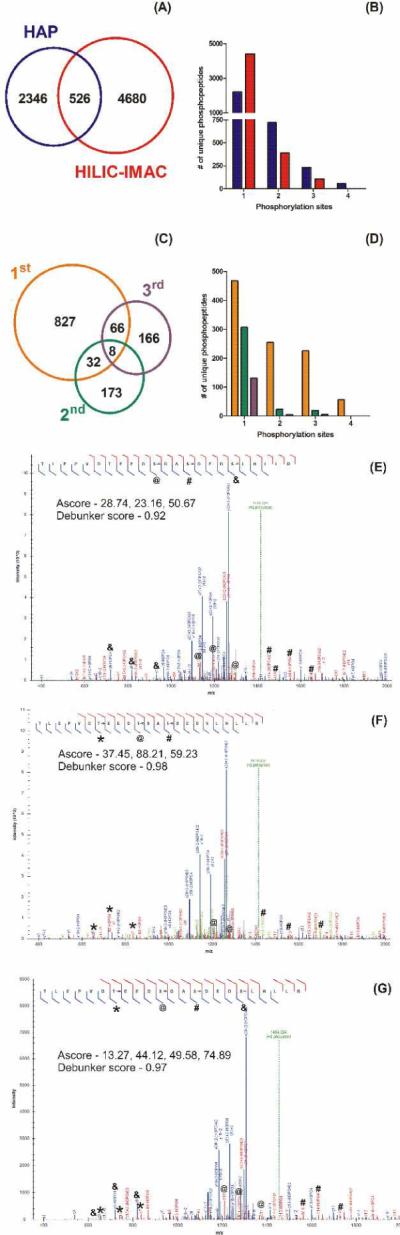
Comparisons of phosphopeptides (A) and the phosphorylation states of phosphopeptides (B) identified using HAP (blue) or HILIC-IMAC (red). Comparisons of the phosphopeptides (C) and the phosphorylation states of phosphopeptides (D) identified from consecutive HAP enrichments (1st enrichment – orange, 2nd – green, and 3rd – purple) from the same sample. Annotated spectra for the triply modified phosphopeptides (E) R.TLEPVDpTEEDpSDApSDEDSLHLLR.A and (F) R.TLEPVDTEEDpSDApSDEDpSLHLLR.A and the quadruply modified (G) R.TLEPVDpTEEDpSDApSDEDpSLHLLR.A.