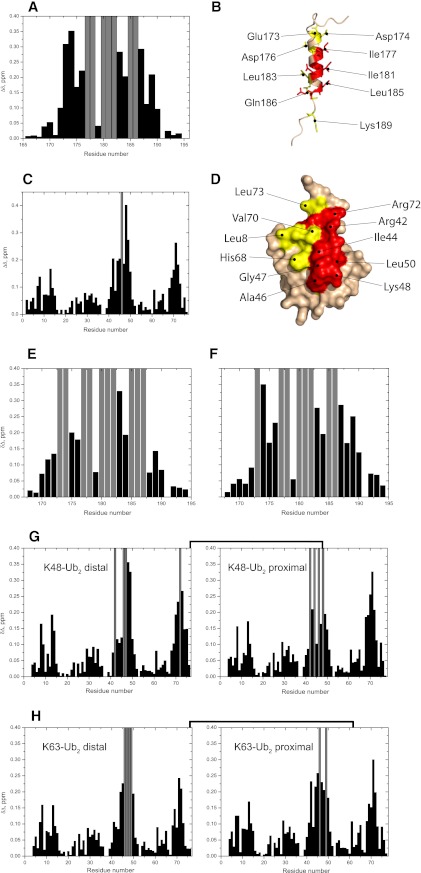
FIGURE 1.
NMR mapping of the interface between UIM and mono-Ub, Lys48- or Lys63-Ub2. Shown are CSPs observed in UIM at the end point of titration with mono-Ub (A), Lys48-Ub2 (E), and Lys63-Ub2 (F), and in mono-Ub (C), Lys48-Ub2 (G), and Lys63-Ub2 (H) upon saturation with UIM. Gray bars indicate residues experiencing intermediate exchange on the NMR time scale, resulting in strong attenuations of their signals in the 1H,15N-HSQC spectra. B and D, mapping of the residues affected by UIM/mono-Ub binding on the three-dimensional structure of UIM (B) and Ub (D) (the UIM structure was obtained by homology modeling, see “Experimental Procedures”). In UIM (B), residues in intermediate exchange are colored red, whereas residues with significant CSPs (Δδ > 0.2) are colored yellow. In Ub (D), residues with significant CSPs (Δδ > 0.2) and/or intermediate exchange are colored red and residues with 0.2 ≥ Δδ > 0.1 are colored yellow.

