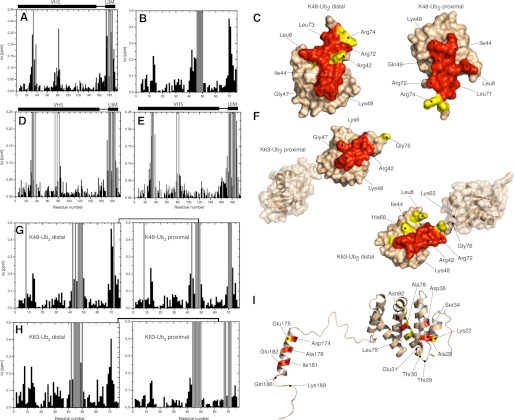
FIGURE 2.
NMR mapping of the interface between VHS-UIM and mono-Ub, Lys48- or Lys63-Ub2. Shown are CSPs observed in VHS-UIM at the end point of titration with mono-Ub (A), Lys48-Ub2 (E), Lys63-Ub2 (D) and in mono-Ub (B), Lys48-Ub2 (G), and Lys63-Ub2 (H) upon saturation with VHS-UIM. Residues experiencing intermediate exchange during the course of titration are represented by gray bars. C and F, mapping of the residues affected by VHS-UIM/Ub2 binding on the three-dimensional surface of Lys48-Ub2 (C) and Lys63-Ub2 (F). I, representation of the residues affected by VHS-UIM/mono-Ub binding on the three-dimensional structure of VHS-UIM. Note that the three-dimensional structure of VHS-UIM results from homology modeling (see “Experimental Procedures”). In Ub2, residues that show significant CSPs (Δδ > 0.15) and/or intermediate exchange are colored red and residues with 0.15 ≥ Δδ > 0.1 are colored yellow. In VHS-UIM, the VHS domain residues that exhibit significant CSPs (Δδ > 0.1) and/or intermediate exchange are colored red and those with 0.1 ≥ Δδ > 0.05 are colored yellow. Residues in the UIM domain that show Δδ > 0.2 and/or intermediate exchange are colored red, residues with 0.2 ≥ Δδ > 0.15 are colored yellow.

