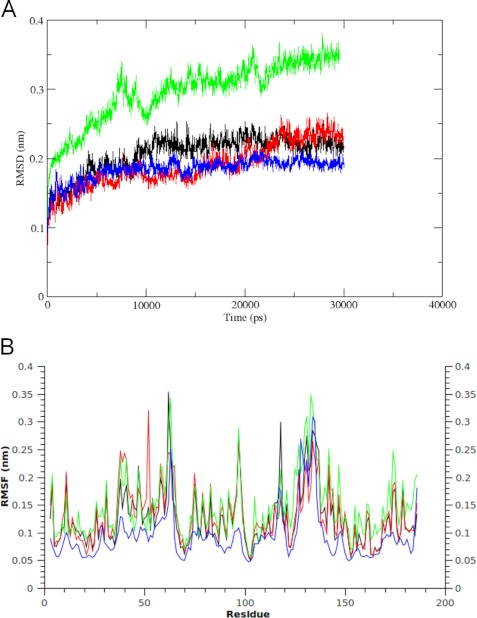
FIGURE 6.
MD simulations of DAQ-bound DJ-1. A, comparison of the RMSD profiles from the respective initial backbone structures over the simulation time. Black, WT DJ-1; red, DJ-1 with Cys-53 covalently bound to DAQ; green, DJ-1 with Cys-106 covalently bound to DAQ; blue, DAQ-bridged covalent dimer. B, residue-based RMSF during the simulation. The profiles are colored as in A.

