
FIGURE 1.
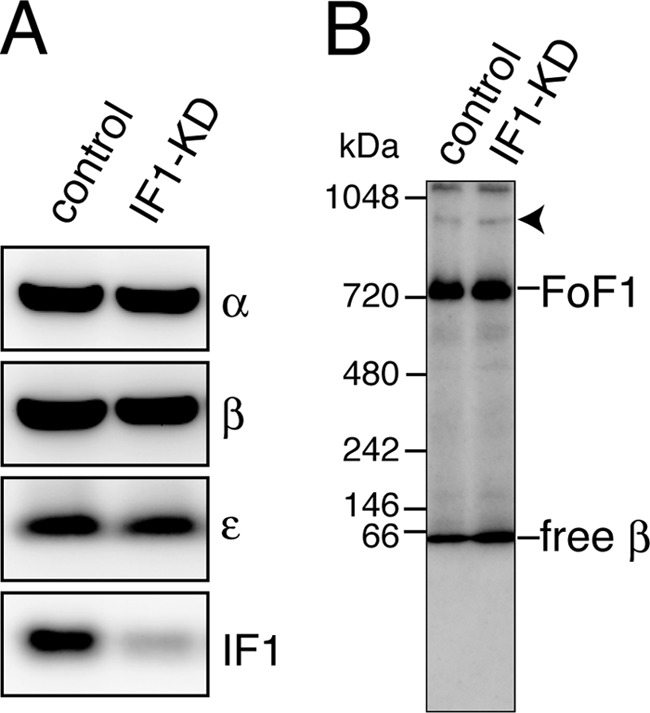
A, the amount of expressed IF1 in mitochondria. B, the amount of assembled FoF1 in mitochondria. Mitochondrial fractions from control and IF1-KD cells were subjected to SDS-PAGE (A) and stained with antibodies against α-, β-, and ϵ-subunits of FoF1 and with anti-IF1 antibody or blue-native PAGE (B) and stained with anti-β-subunit antibody. Arrowhead indicates the position of dimer of FoF1.