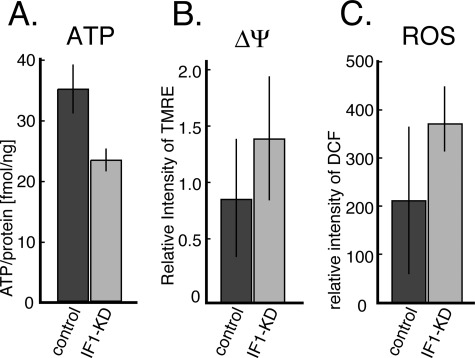
FIGURE 2.
A, the amounts of ATP contained in IF1-KD and the control cells. The amounts of ATP relative to the amount of total proteins are shown. B, mitochondrial membrane potential (Δψ) estimated from TMRE fluorescence intensities averaged from 400 cells (p < 0.01). C, ROS levels in IF1-KD (n = 24) and control (n = 16) cells estimated from fluorescence intensities of dichlorofluorescein (DCF) (p < 0.01). Experimental details are as described under “Materials and Methods.” The error bars indicate S.D.

