FIGURE 3.
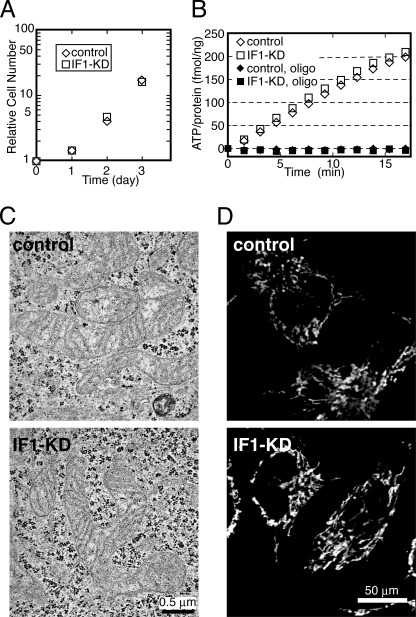
A, cell growth of IF1-KD and control cells. Cells were grown in optimum growth conditions (DMEM). Relative cell numbers are plotted. B, ATP synthesis activity of mitochondria in IF1-KD and control cells measured by MASC assay. Synthesized ATP was monitored with luciferase. Oligomycin (oligo) was added for the negative controls. C, typical electron microscopic images of IF1-KD and control cells. The scale bars are 500 nm. D, typical images of IF1-KD and control cells stained with TMRE. The scale bars are 50 μm. Experimental details are as described under “Materials and Methods.”

