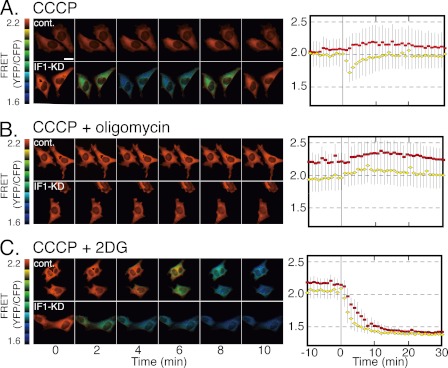
FIGURE 4.
A–C, change of cytoplasmic [ATP] upon loss of pmf by addition of CCCP. [ATP] was monitored by an ATP-sensing probe, ATeam, in which the yellow fluorescence domain (YFP) comes closer to the cyan fluorescence domain (CFP) when the middle domain binds ATP, causing FRET. Left panels, typical FRET images of cells, representing by ratio of YFP/cyan fluorescence domain (1.6 (blue) to 2.2 (red)); right panels, changes of FRET values averaged from randomly chosen cells. Cell numbers of control and IF1-KD cells used for averaging were 17 and 23 (A), 18 and 13 (B), and 9 and 17 (C). The error bars indicate S.D. Diamonds, IF1-KD cells; squares, control cells. At time zero, CCCP (A; 50 μm), CCCP+oligomycin (B; 10 μg/ml), or CCCP+2-deoxyglucose (C; 10 mm) was added. The scale bar in A is 20 μm.

