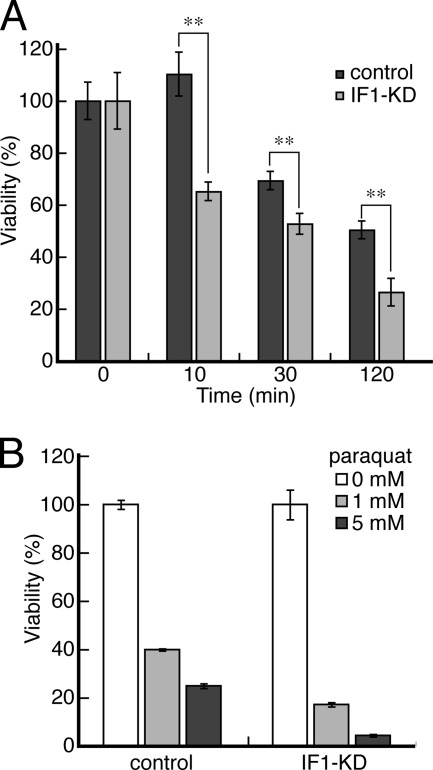
FIGURE 6.
A, viability of IF1-KD and control cells in 10 mm 2-deoxyglucose and 5 mm KCN (chemical ischemia). Cells were exposed to chemical ischemia for 0, 10, 30, and 120 min, and living cells were counted (n = 6). The double asterisk indicates that the p value is <0.01. B, viability of IF1-KD and control cells under ROS-producing conditions. Cells were cultured in 0, 1, and 5 mm paraquat for 2 days, and living cells were counted (n = 6). The living cell numbers in the absence of paraquat are set at 100%.

