FIGURE 4.
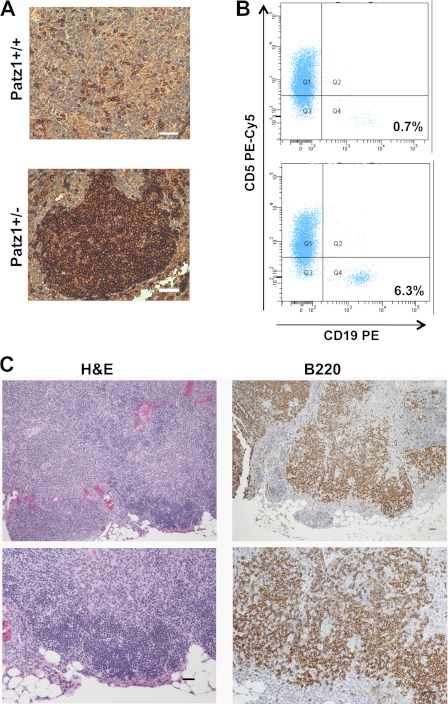
Thymus neoplasias in Patz1 knock-out mice. A, immunohistochemical analysis in representative thymus sections of Patz1+/+ and Patz1+/− mice. B220 staining shows the presence of a focal B cell hyperplasia in the medulla of the mutant sample, whereas only scattered B cells were present in the wild-type control. Scale bars, 100 μm. B, flow cytometry dot blots of the thymi showed in B stained with CD19 and CD5 antibodies. A distinct population of cells that positively stains with CD19-PE antibody in the Patz1+/− (lower panel) is evident. No appreciable CD19+ cell population was found in the wild-type control (upper panel). For each analysis, 10,000 events were counted. The relative percentage of CD19+ cells (B lymphocytes) was indicated in the right-bottom corner of each dot plot. PE, Phycoerythrin. C, representative sample of a thymus B cell lymphoma developed by a Patz1+/− mouse. Left panels, hematoxylin and eosin staining; right panels, immunostaining for B220. Scale bars, 100 μm.

