FIGURE 3.
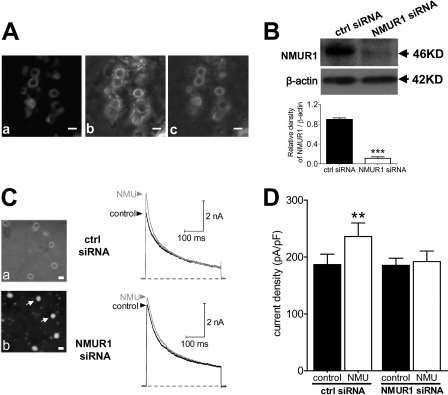
NMU-mediated response is prevented by NMUR1 knockdown. A, membrane expression of NMUR1 determined by confocal microscopy. a, fluorescent signals of NMUR1. b, differential interference contrast images. c, merged picture. Scale bar, 25 μm. B, protein expression of NMUR1 (46 kDa) was measured using Western blot analysis in control siRNA (ctrl siRNA) and NMUR1 siRNA-treated groups. β-Actin (42 kDa) showed the equal loading. C, left, photomicrographs of phase-contrast (a) and fluorescent images (b) of small DRG neurons transfected with the NMUR1 siRNA. Scale bar, 20 μm. Right, representative current traces showed the effects of control siRNA or NMUR1 siRNA on the NMU-induced IA increase. D, summary data showed the effects of control siRNA (n = 8) or NMUR1 siRNA (n = 9) on the 1 μm NMU-induced IA increase in small DRG neurons. **, p < 0.01 versus control.

