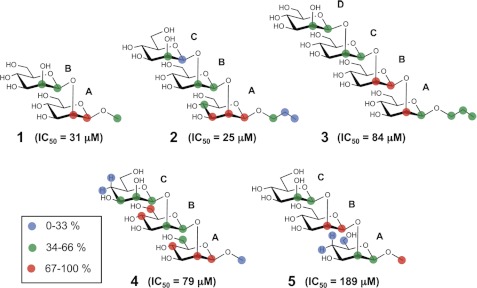
FIGURE 5.
Graphical representation of STDD enhancements for the oligosaccharides 1–5 binding to the IgG C3.1 (numerical data given in Table 1). The enhancement magnitudes of each resonance (isolated resonances only) are indicated by colored circles; all magnitudes are relative to the most strongly enhanced resonance in each spectrum.

