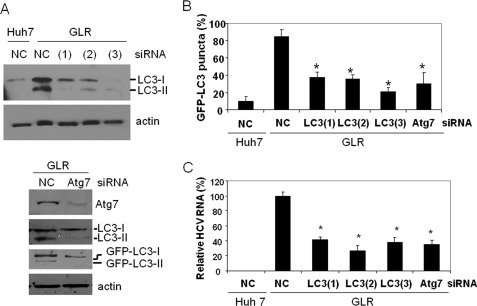
FIGURE 2.
Suppression of LC3 and Atg7 expression results in reduction of HCV RNA levels in replicon cells. A, Western blot analysis of LC3 and Atg7. HCV GLR replicon cells were transfected with the negative control siRNA (NC), LC3 siRNA, or Atg7 siRNA and then lysed for Western blot analysis. (1), (2), and (3) indicate GLR cells transfected with LC3(1), LC3(2), and LC3(3) siRNAs, respectively. Huh7 cells transfected with the control siRNA were used as the control in the LC3 knockdown experiment (upper panels). β-Actin was also analyzed as a loading control. For Atg7 knockdown (lower panels), the lipidation of both endogenous LC3 and ectopically expressed GFP-LC3 was analyzed. GFP-LC3-I, non-lipidated GFP-LC3; GFP-LC3-II, lipidated GFP-LC3; LC3-I, non-lipidated LC3; LC3-II, lipidated LC3. B, reduction of GFP-LC3 puncta by LC3 and Atg7 siRNA knockdown. Percentages of cells that were positive for more than five GFP-LC3 puncta are shown. Approximately 100–200 cells were counted from different viewing fields under the microscope. C, quantitative analysis of HCV RNA levels in replicon cells. Total cellular RNA was isolated 3 days after the siRNA treatment for quantitative real-time RT-PCR analysis of the HCV RNA. The GAPDH RNA was also analyzed as an internal control. The HCV RNA level in cells treated with the negative control siRNA was arbitrarily defined as 100%. *, statistically significant (p < 0.005).

