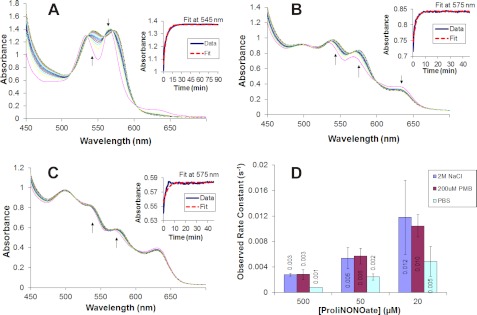
FIGURE 7.
Effect of dimer-promoting agents on reductive nitrosylation. Panels A–C show selected spectra during the reductive nitrosylation of 100 μm methemoglobin in 200 μm PMB at various ProliNONOate concentrations. Arrows indicate the direction of change in the spectra. The insets show the change in absorption versus time at the given wavelength along with the first order kinetics fit. A, 500 μm ProliNONOate spectra taken every 30 s for 45 min. B, 50 μm ProliNONOate spectra taken every minute for 1 h. C, 20 μm ProliNONOate spectra taken every 30 s for 45 min. D, the observed rate constants for the reductive nitrosylation of hemoglobin with different effectors.

