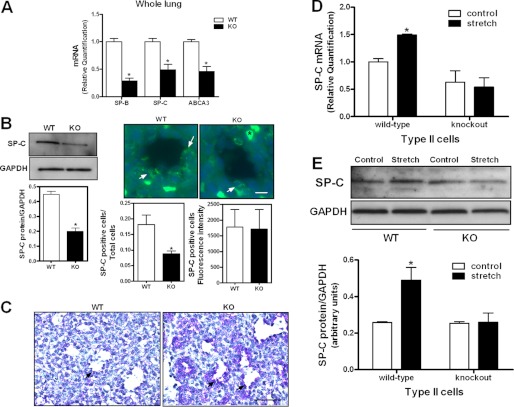
FIGURE 1.
Type II cell differentiation in EGFR knock-out mice. A, E17 lungs from wild-type (WT) and knock-out (KO) mice were processed by qRT-PCR to assess mRNA expression of SP-B, SP-C, and ABCA3 genes. n = 3; *, p < 0.05 versus WT. B, left panels: lungs were isolated on E17 of gestation from WT and KO mice and processed by Western blot to detect SP-C protein levels (n = 3; *, p < 0.01). Right panels, lung tissue from WT and KO mice was processed, as described in “Experimental Procedures,” to evaluate the presence of SP-C-positive cells (green, arrows). Nuclei were counterstained with DAPI (blue) * (red blood cell). Bar, 20 μm. Shown are representative images from three independent experiments. Graphs depict quantification of SP-C-positive cells normalized to the total number of epithelial cells present in the acinar tubules/sacs (n = 3; *, p < 0.05) and fluorescence intensity of SP-C-positive cells between WT and KO tissues. C, PAS staining of E17 lung tissue demonstrating an increase of glycogen-positive epithelial cells (arrows) in the acinar tubules/sacs of knock-out lungs when compared with normal lungs. Bar, 100 μm. D, type II cells from WT and KO mice were isolated on E17 of gestation and exposed to 5% cyclic stretch for 16 h. Samples were analyzed by qRT-PCR to assess SP-C mRNA expression. n = 3; *, p < 0.05 versus control. E, type II cells from WT and KO mice were isolated on E17 of gestation and exposed to 5% cyclic stretch for 16 h. Samples were processed by Western blot to detect SP-C protein abundance. The upper panel shows a representative blot. n = 3; *, p < 0.05 versus control.

