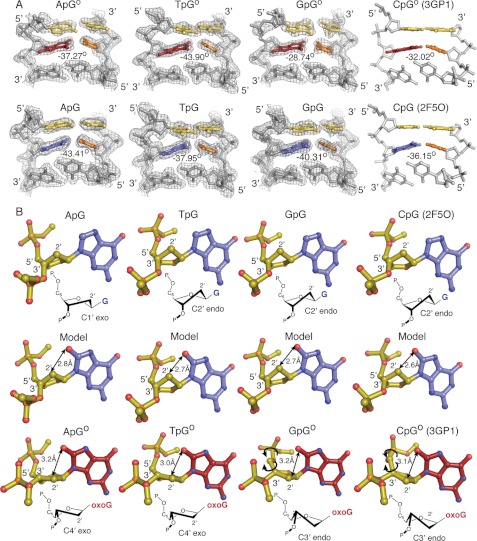
FIGURE 2.
A, buckling of the target base pair and the 3′-neighboring base pair is shown. The target base is shown as red for oxoG and blue for G, with the cytosine base-pairing partner shown in orange. The 5′-stacking neighbor base pair to the target base is shown in yellow. Buckle angles were calculated using 3DNA. The 2 Fo − Fc maps for the new structures reported in this manuscript are contoured to 1.0 σ. B, steric clashes resulting from the O8 carbonyl are shown. Double-headed arrows indicate the distance between the O8 atom and the C2′ carbon when modeled into a NpG structure or in the NpGo structure. The sugar pucker for each structure is as indicated. Single-headed arrows indicate rotations in the phosphodiester bonds.

