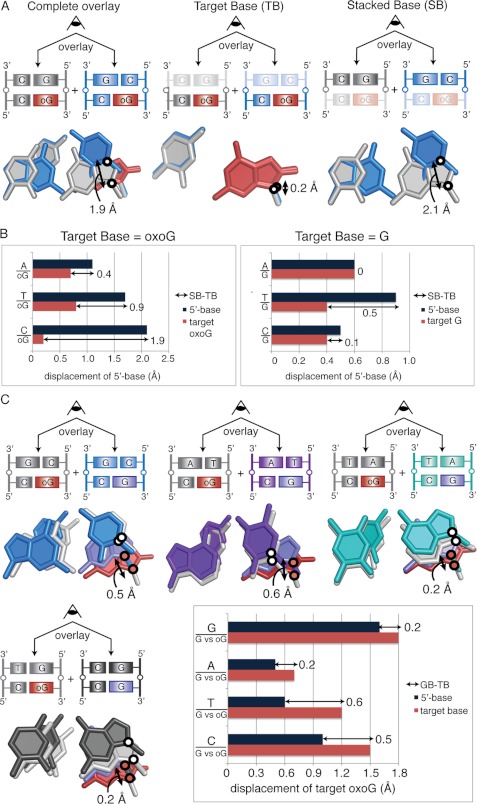
FIGURE 4.
A, calculation of net displacement of the 5′-stacking neighbor is shown. The CpGo structure is shown in blue, and the GpGo structure is shown in gray. Black circles mark the position of the glycosidic nitrogens used for the measurements. Each base pair is viewed down the helical axis. Measurement of the displacement of the SB is shown to the far right and of the TB is in the middle. Subtraction of TB from SB results in the net displacement of the stacked base, shown to the far left. B, the distances between glycosidic nitrogens measured for each NpGo aligned with GpGo pair are shown for NpGo (left) and NpG structures (right). C, shown is net displacement of oxoG compared with G in the NpG versus NpGo structures. White circles mark the glycosidic nitrogens on the 5′-base-stacking partner, and red circles mark the glycosidic nitrogens on the target base. Overlays are shown for CpG/Go (blue), TpG/Go (purple), ApG/Go (teal), and GpG/Go (gray) alignments. The net displacement was calculated using the average of the distance between oxoG and G from both conformations. The net displacement of the target base is calculated by subtracting the movement of 5′-base (dark blue bars) from the movement of the target base (pink bars).

