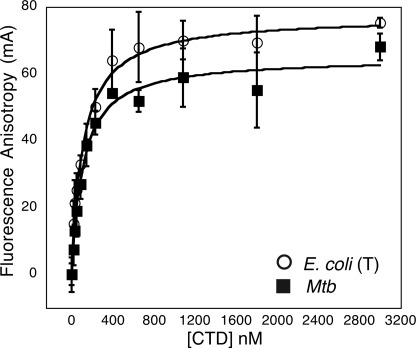
FIGURE 2.
DNA binding by CTD constructs. Binding of fluorescein-tagged, double-stranded oligonucleotides (20 nm), monitored as a function of CTD concentration by fluorescence anisotropy, is shown. The apparent Kd values are as follows: truncated E. coli CTD, 90 ± 21 nm; M. tuberculosis (Mtb) CTD, 80 ± 16 nm. The truncated E. coli CTD is indicated by T.

