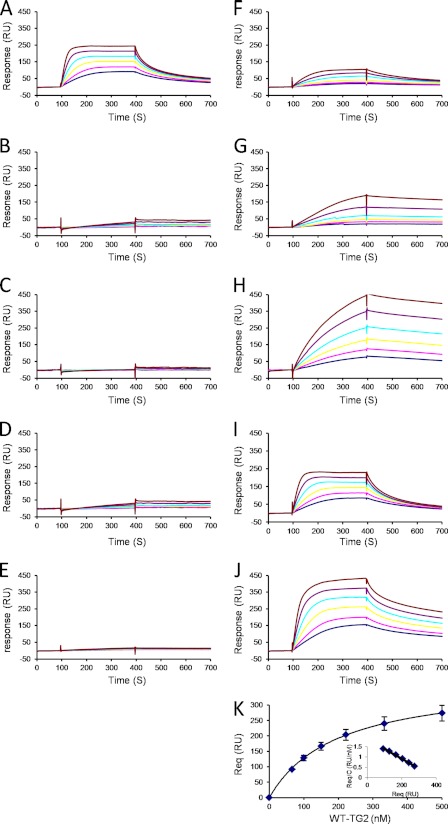
FIGURE 3.
Binding of wt and mutant TG2 to immobilized heparin. Wt TG2 (A), mutants M1a (B), M1b (C), M1c (D), M3 (E), M4 (F), M5 (G), M7 (H), M2 (I), and M6 (J) were injected over a heparin-activated surface at a flow rate or 20 μl/min for 5 min, after which running buffer was injected, and the response in resonance units was recorded as a function of time. Each set of sensorgrams was obtained with TG2 molecules at (from top to bottom) 500, 333, 222, 150, 100, and 66 nm. K, steady state values at equilibrium plotted against the injected concentration of WT-TG2 and fitted to Req = Rmaxeq/(KD + c) are shown. Inset, Scatchard plot (Req/c versus Req) of the corresponding data. Req values are the steady state values at equilibrium recorded at the end of the association phase, and c is the concentration of injected proteins. Samples for which the association phase reached equilibrium (wt, M2, and M6) were analyzed similarly. Experiments were performed in duplicate.

