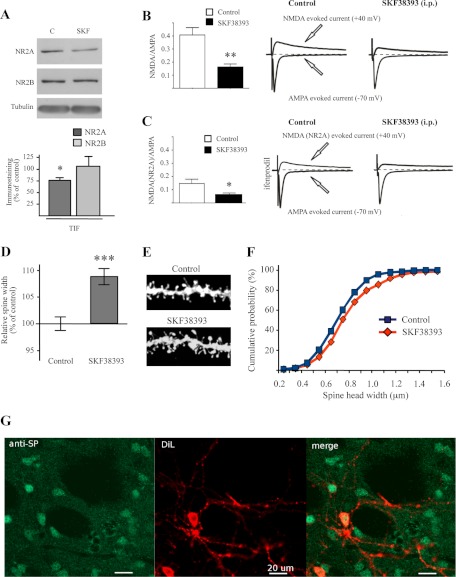
FIGURE 6.
In vivo treatment with D1 receptor agonist SKF38393. A, Western blot analysis of NR2A and NR2B subunits performed in TIF fraction obtained from striatum of control and SKF38393-treated rats (2 mg/ml/kg, 45 min). The same amount of proteins was loaded in each lane (t test; *, p < 0.05). B, the bar graph on the left panel shows the effect of in vivo administration of SKF38393 (2 mg/ml/kg) on the NMDA-AMPA ratio compared with the control condition (**, p < 0.01; control, 0.424 ± 0.188; SKF38393, 0.16 ± 0.066; for each group, n = 10). In the right panel are reported averaged traces of AMPA currents (−70 mV in the presence of picrotoxin) and NMDA-evoked current (+40 mV, in the presence of picrotoxin and CNQX) in control condition (left side) and after in vivo administration of 2 mg/ml/kg SKF (right side). C, the bar graph on the left panel shows the effect of in vivo administration of SKF38393 on the NMDA(NR2A)-AMPA ratio. In the right panel are presented averaged traces of AMPA currents and NMDA(NR2A) currents (+40 mV in the presence of picrotoxin, CNQX, and ifenprodil) in control condition (left side) and after in vivo administration of SKF (right side) (*, p < 0.05; control, 0.146 ± 0.086; SKF38393, 0.063 ± 0.03, respectively, n = 7 and n = 6). D, diagram showing relative average spines head width (t test; n > 380 spines from nine different neurons for each group; ***, p < 0.0001 SKF38393 versus control). F, cumulative frequency plots of spine head width of MSNs from control (blue) or SKF38393-treated (red) rats. E, representative images show dendrites of MSNs from control or SKF38393-treated rats. G, immunohistoschemistry showing colocalization of SP-positive neurons (anti-SP, green) and diolistic labeling (DiL, red).

