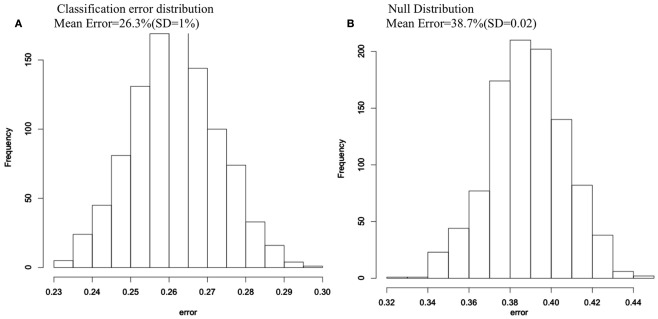
Figure 1.
Classification error histograms for (A) 1000 Random Forest runs using 74 cortical and subcortical regions to predict group membership for COS and control groups; (B) 1000 Random Forest runs using 74 cortical and subcortical regions to predict group membership after group membership was randomly permuted each run.

