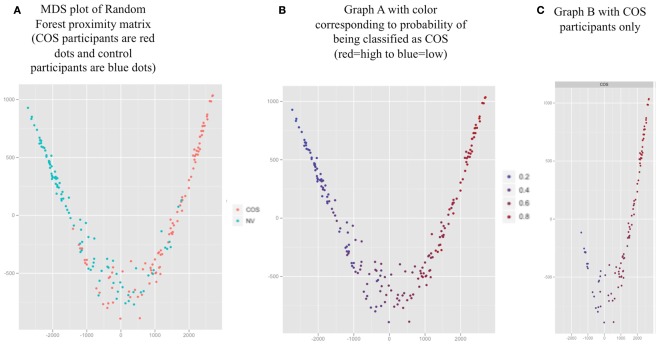
Figure 3.
Proximity values averaged over 1000 Random Forest runs for all participants (represented by the dots) visualized with two dimensional multidimensional scaling (MDS). (A) MDS plot of Random Forest proximity matrix (COS participants are red dots and control participants are blue dots). (B) Graph A with color corresponding to probability of being classified as COS (red = high to blue = low). (C) Graph B with COS participants only.

