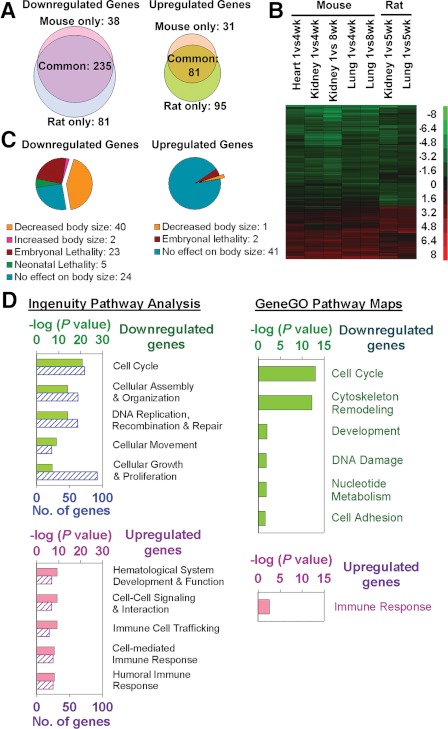
Fig. 2.
A complex growth-related genetic program occurs in multiple organs during juvenile life. A, Venn diagrams showing the number of genes down-regulated and up-regulated with age by microarray analysis in mouse and rats. The analysis included genes that showed age regulation (P < 0.05; ≥2.0-fold) in mouse kidney, lung, and heart or in both rat kidney and lung. The substantial overlap indicates that the program was highly conserved during the 20 million yr since the two species diverged. B, Heat maps based on the same set of genes. Each row corresponds to a single gene. Green, Down-regulation with age; red, up-regulation. Scale values are log2 (fold difference). C, A knockout phenotype was reported for 139 of the genes in this same gene set. For the down-regulated genes, knockout frequently resulted in decreased body size, suggesting that many down-regulated genes in this program are growth promoting. D, Bioinformatic analyses of these age-regulated genes using Ingenuity Pathway Analysis (IPA) 7.1 and GeneGO also suggest that many of the genes that are down-regulated with age serve to regulate proliferation. For IPA, the five most overrepresented molecular, cellular, or physiological functions are shown (solid bars, P value; striped bars, number of significant genes involved). For GeneGO, all significant (P < 0.05) map folders are shown. [Reproduced from J. C. Lui et al.: FASEB J 24:3083–3092, 2010 (113).]

