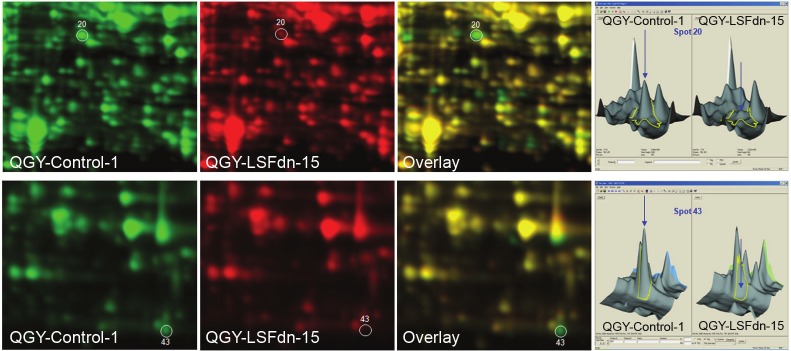
Figure 3.
Dual color 2D DIGE detecting protein expression in Control-1 and LSFdn-15 clones of QGY-7703 cells. Leftpanel shows single color and overlay images. Right panel shows peak intensities of Spot 20 and Spot 43. Spot 20and Spot 43 represent Dihydrofolate reductase (DHFR) and thymidylate synthase (TS), respectively. LSF and hepatocellular carcinoma (HCC).

