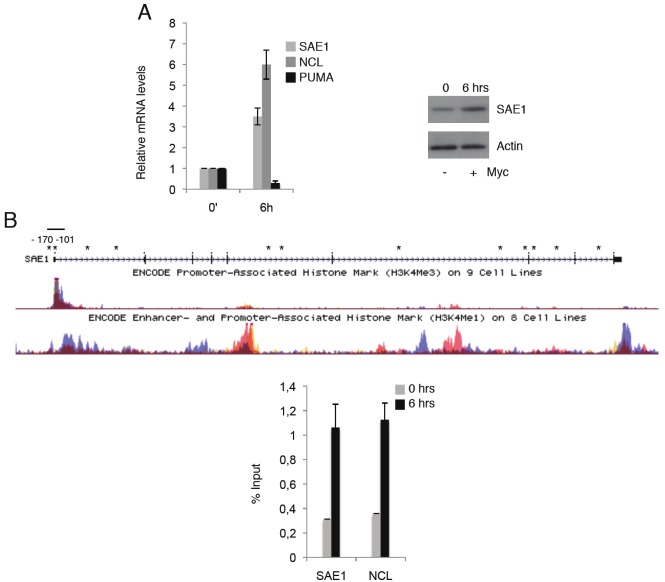
Figure 2.
(A) hT-RPE-MycER cells were synchronized by 2 days of growth factors deprivation. SAE1, NCL and PUMA mRNAs expression levels were quantified by qRT–PCR in synchronized (0) and cells treated with growth factor + OHT (6hrs). All mRNA levels were normalized to β-glucuronidase (GUS) mRNA levels and all values represent the average of at least three independent experiments. Error bars indicate SD. Protein expression is shown in immunoblots of whole-cell extracts with anti-SAE1 and actin for loading control. (B) An adapted UCSC genome browser view of SAE1 genomic sequence displaying H3K4me3 and H3K4me1 levels and putative E-box (asterisks). Myc occupancy on SAE1 and NCL chromatin in synchronized (0) and Myc induced hT-RPE-MycER cells for 6hrs is shown. ChIP-enriched DNA was quantified by real-time PCR analysis using amplicon covering the region containing the Myc binding E-boxes as shown in Figure 2A.

