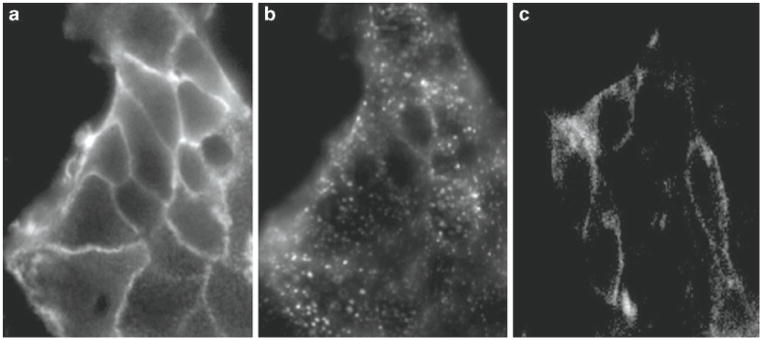
Fig. 2.
In vitro imaging of Cy5-labeled htBVL 9 (conc.: 5 nM) of cells expressing both CCK-2R and hMC4R (a, b) or CCK-2R only (c). Images (a) and (c) were acquired 2 min following incubation with the ligand, while image (b) was acquired 10 min after ligand addition to the same cells shown in (a). The difference in fluorescence intensity levels between (a) and (c) is due to greater than 40-fold higher binding to the dual receptor expressing cells (a) than to the monoexpressing cells (c), at this ligand concentration. (b) Capping and endocytosis of ligand/receptor complex was nearly complete after 5 min at which time the addition of a saturating concentration of cold ligand to the media had no effect on the fluorophore intensity or distribution, i.e., the receptors were internalized.

