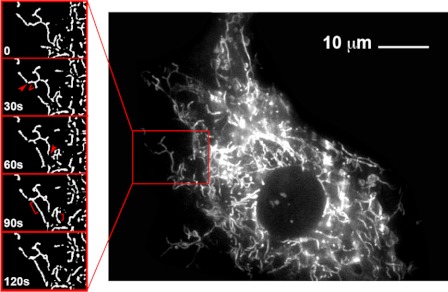
Figure 2.
Visualization of the dynamic nature of the mitochondrial reticulum in a cultured muscle cell. C2C12 mouse myoblasts were stained with MitoTracker green and imaged in culture at 37 C. Images of a segment of the cell captured at 30-sec intervals are shown on the left. The comparison between successive frames reveals scission events (arrowheads), branching events (V), and fusion events (brackets) occurring at 30-sec intervals.

