
Fig. 3.
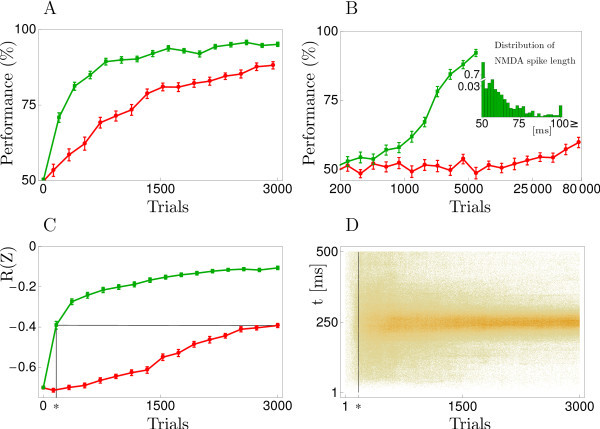
Balanced cell reinforcement (bCR, Equation 26) compared to zone reinforcement. (A) Average performance of bCR (green) and ZR (red) on the same task as in panel 6A. (B) Performance when learning stimulus-response associations for four different patterns; bCR (green), ZR (red), a logarithmic scale is used for the x-axis. The inset shows the distribution of NMDA-spike durations after learning the task with bCR. The performance values in the figure are averages over 40 runs, and error bars show 1 SEM. (C) Development of the average reward signal for bCR (green) and ZR (red) when the task is to spike at the mid time of the single input pattern (, where , , is the ith of the n output spike times, the target spike time, and the pattern duration; if there was no output spike within we added one at T, yielding ). (D) Spike raster plot of the output spike times Z with shown in C using bCR. With ZR, the distribution of spike times after 3000 trials roughly corresponds to the one for bCR after 160 trials (vertical line at ∗), where the two performances coincide (see ∗ and black lines in C). The mean and standard deviation of the spike times at the end of the learning process, averaged across the last 300 trials, was and for bCR and ZR, respectively.