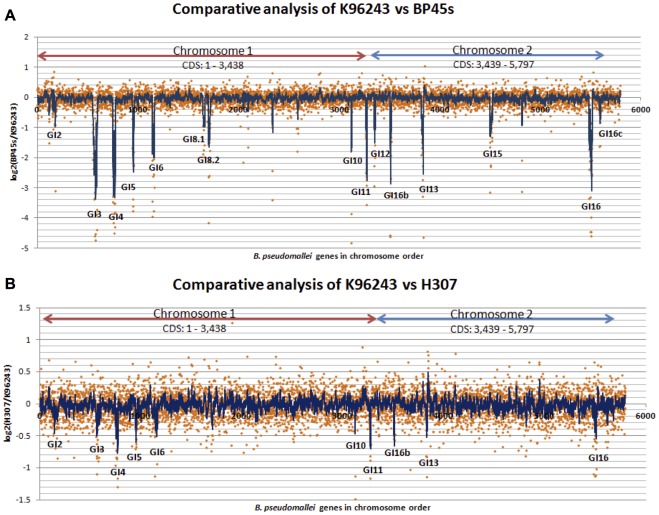
Figure 1. Comparative genome analyses of B. pseudomallei K96243 with B. pseudomallei from environmental and clinical isolates.
The comparison between K96243 and environmental isolate (BP45s) was shown in (A) and clinical isolate (H307) in (B). The log2 hybridization ratio of the tested isolate over the K96243 was plotted on the Y axis and positions of genes on the X axis. Low values of the Log2 hybridization ratio, seen as peaks, imply absence of genes designated as GIs. The slide averaging window of 6 genes, one gene per step, was applied to the normalized data and smoothed out the fluctuations of the data. Each GI contains at least 6 CDS that have values less than −2SD.

