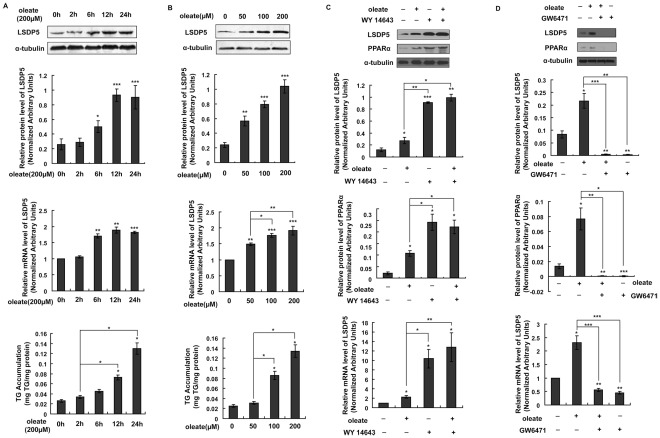
Figure 2. The effect of oleate exposure on the expression of LSDP5.
(A) AML12 cells were incubated with 200 µM oleate for the indicated time. Representative Western blots are shown (top panel), and LSDP5 transcript levels were measured using real-time PCR (middle panel). Expression levels of LSDP5 are expressed as a ratio to α-tubulin (representative of three experiments). * P<0.05, ** P<0.01, *** P<0.001. The relative mRNA level before oleate exposure (0 h) was designated as 1.0. n = 6, ** P<0.01, *** P<0.001. The amount of TGs in AML12 cells treated with oleate for different times was assessed with a TG test kit, and is expressed as mg TG/mg protein (bottom panel). n = 5, * P<0.05, ** P<0.01, *** P<0.001. Data are presented as the mean±SEM. (B) AML12 cells were incubated with different concentrations of oleate (0, 50, 100, and 200 µM) for 24 h. Protein extracts were analyzed by Western blotting (top panel), and total RNA was subjected to real-time PCR (middle panel). n = 6,* P<0.05, ** P<0.01, *** P<0.001. The amount of TGs in AML12 cells treated with different concentration of oleate was assessed with a TG test kit (bottom panel). n = 5, * P<0.05. Data are presented as the mean±SEM. (C,D) Effect of WY14643 or GW6471 on oleate-induced LSDP5 expression in AML12 cells. AML12 cells were exposed to oleate (200 µM) in the absence or presence of WY 14643 (30 µM) or GW6471 (10 µM) for 24 h. The expression of LSDP5 (top panel) and PPARα (middle panel) was monitored by Western blotting. LSDP5 transcript levels were measured using real-time PCR (bottom panel). The relative mRNA level of AML12 cells in equivalent amounts of BSA was designated as 1.0. Data are presented as the mean±SEM (n = 4–6), * P<0.05, ** P<0.01, *** P<0.001 (Dunnett’s post hoc test following a one-way ANOVA).

