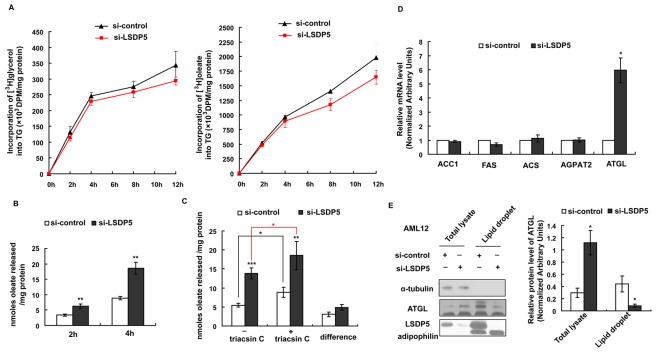
Figure 5. Triglyceride synthesis and lipolysis in AML12 cells lacking LSDP5.
(A) Incorporation of [3H]-glycerol or [3H]-oleate into TG in control and si-LSDP5 cells. Data were normalized to the number of cells and are expressed as the mean±SEM (n = 4). (B) Time courses of [3H]-oleate release from si-control and si-LSDP5 cells. Trypan blue staining was used to count the living cells. Data were normalized based on cell viability and total protein content. Data are presented as the mean±SEM (n = 4), ** P<0.01. (C) The effect of LSDP5 silencing on re-esterificaiton and hydrolysis. After lipid loading, the [3H]-oleate release after 4 h with or without triacsin C was assessed. The efflux of [3H]-oleate without triacsin C reflected the total lipolysis level, the efflux of [3H]-oleate with triacsin C reflected the TG hydrolysis level, and the difference between TG hydrolysis and total lipolysis reflected the level of re-esterification. Data were normalized based on cell viability and total protein level. Data are presented as the mean±SEM (n = 4–5), * P<0.05. (D) The mRNA levels of ACC1, FAS, ACS, AGPAT and ATGL were assessed using real-time PCR. The relative mRNA level in the control group was designated as 1.0. Data are presented as the mean±SEM (n = 6), * P<0.05. (E) Lipid droplet fractions were isolated by subcellular fractionation and analyzed by immunoblotting for LSDP5, adipophilin, and ATGL. 20 mg of total hepatocyte lysate and 5 mg of lipid fraction were loaded for immunoblotting analysis. Expression levels of ATGL are expressed as a ratio to α-tubulin in the total lysate and as a ratio to adipophilpin on lipid droplets (representative of four experiments). Data are presented as the mean±SEM, * P<0.05. Data in this figure were analyzed with paired Student’s t tests.

