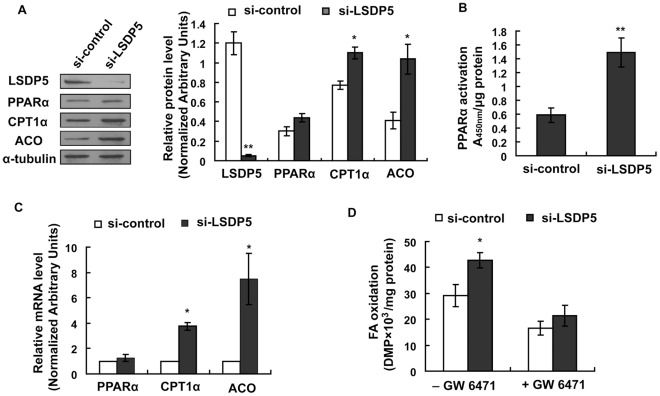
Figure 7. Effect of LSDP5 silencing on PPARα expression and activity.
(A) A representative immunoblot for PPARα, LSDP5, CPT1α and ACO as detected by chemiluminescence. Expression levels of each protein are expressed as a ratio to α-tubulin (representative of four experiments). Data are presented as the mean±SEM, * P<0.05, ** P<0.01. (B) PPARα activity was determined by a binding assay using nuclear protein from si-control and si-LSDP5 cells and an oligonucleotide corresponding to the PPARα consensus sequence. The activity of PPARα significantly increased when LSDP5 was knocked down. The results are presented as the absorbance at 450 nm (A450) wave length/µg protein. Data are presented as the mean±SEM (n = 5), * P<0.05. (C) Quantitative analysis of the mRNA level of using LSDP5, CPT1α and ACO as determined by real-time PCR and expressed relative to the corresponding siRNA control group. Data are presented as the mean±SEM of three independent experiments. (D) Effect of GW6541 on increased β-oxidation in LSDP5-depleted hepatocytes. Data are presented as the mean±SEM (n = 5), * P<0.05. Data in this figure were analyzed with paired Student’s t tests.

