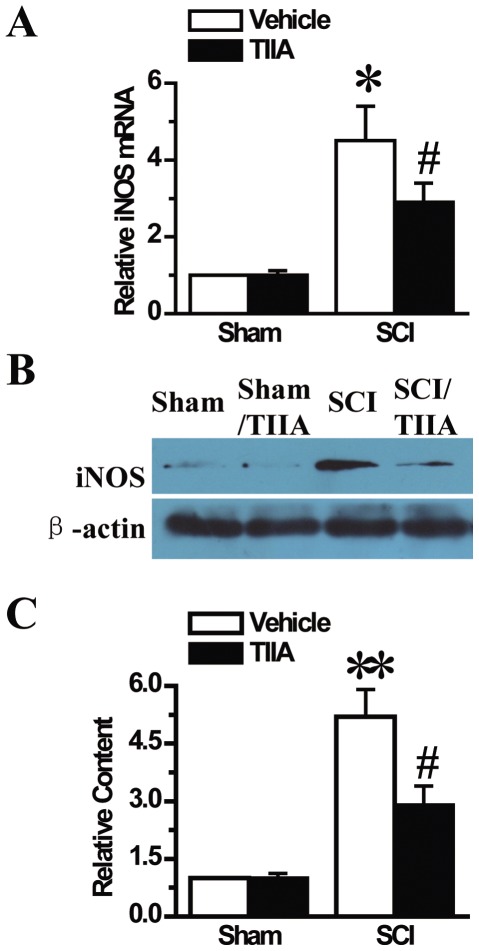
Figure 7. Effects of TIIA on the expression of iNOS at 24 h after SCI.
RT-PCR results demonstrated that the expression of iNOS was increased after SCI. Treatment of TIIA decreased the mRNA level of iNOS compared to the SCI group (A). Western blot analysis demonstrated that the protein expression of iNOS was increased in the tissues from the SCI group, but the treatment of TIIA significantly reduced the level of iNOS (B). The analyzed data for relative iNOS protein content are shown (C). Bars represent means ± SEM. *p<0.05, **p<0.001 vs. sham group; # p<0.05 vs. SCI group.

