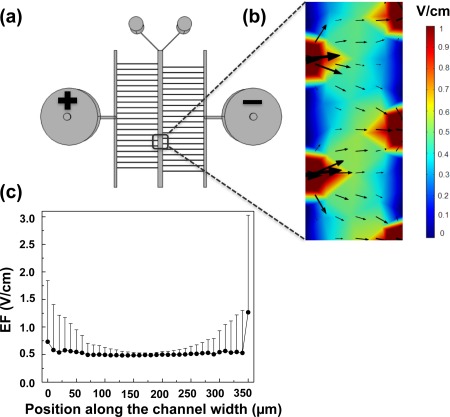
Figure 2.
Simulation of dcEF in the microfluidic device. (a) Top view of the microfluidic device. A 10 V of electrical potential difference was applied to the device from the two electrode wells. (b) The color map and the arrows indicate the magnitude and the direction of the dcEF in the main channel (0.75 mm (L) × 0.35 mm (W) at ∼7 mm downstream of the main channel). (c) Plot of simulated dcEF across the main channel width in the region as in (b). The dcEF is presented as the average value with the error bar as the standard deviation (SD). The simulation results show that dcEF is relatively uniform in the defined center region of the main channel and its magnitude can be configured to be within the physiological strength range.

