FIGURE 4.
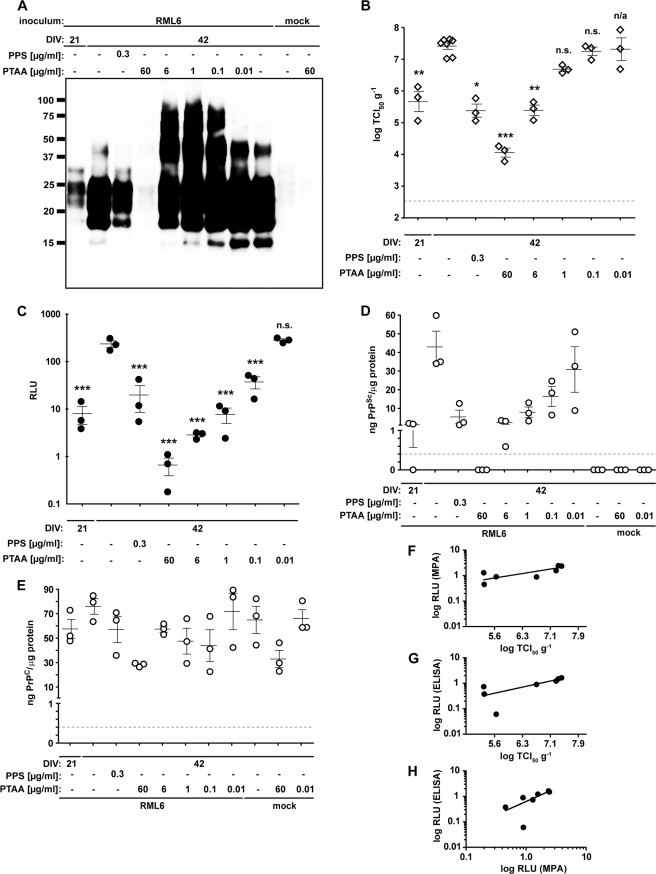
PTAA affects prion replication, accumulation, and neurodegeneration in slice cultures. A, immunoblot from prion-infected slice cultures obtained from tga20 mice treated with different concentrations of PTAA. Cultures were harvested after 21 or 42 DIV, and 20 μg of total protein from all samples was digested with PK. The anti-PrP antibody POM1 was used for detection. Molecular sizes are indicated in kDa. The experiment was performed in biological triplicates, and the immunoblot shown here is representative for the individual experiments. B, SCEPA of noninfected (mock) and RML6-infected slice cultures after exposure to PTAA. Infectivity of noninfected cultures harvested after 21 or 42 DIV are shown for comparison. PPS was used as a positive control. Each diamond represents the TCI50 g−1 of one slice of culture homogenate determined by serial 10-fold dilutions from 10−4 to 10−8 on a 96-well plate. Error bars indicate the mean ± S.E. of biological triplicates. p values represent the statistical differences between PTAA-treated and nontreated homogenates from RML6-infected slice cultures and are shown in supplemental Table S7. ***, p < 0.001; **, p < 0.01; *, p < 0.05. Detection limit (dashed line), theoretical titer based on the observation of false-positives at concentrations between 10−2 and 10−3 of noninfectious inoculum (CD1). n.s., nonsignificant. n/a, these results were not included into the statistical analysis. Because of mathematical complexity, a statistical analysis could not be performed for slice cultures treated with 0.01 μg ml−1 PTAA. C, MPA of the slice culture homogenates shown in A. Each dot represents the average value of technical triplicates for one slice culture homogenate. Error bars represent the mean ± S.E. of biological triplicates. All data were corrected for the negative control (mock) and represented as relative light units (RLU). p values represent the statistical differences between PTAA-treated and nontreated homogenates from RML6 slice cultures and are shown in supplemental Table S8. ***, p < 0.001. D and E, sandwich ELISA of the same homogenates as in A analyzed for PrPSc (D) and PrPC (E). Each dot represents the average value of technical duplicates for one slice culture homogenate. Error bars represent the mean ± S.E. of biological triplicates. All data were normalized to protein concentration of the corresponding sample. p values are shown in supplemental Table S8. The ELISA was developed with a colorimetric substrate. The detection limit of 400 pg ml−1 (dashed line) was determined as the average background levels plus three times S.D. F, correlation diagram to show the relationship between the MPA and SCEPA data presented in B and C. G, correlation diagram to show the relationship between the SCEPA and ELISA data presented in B and D. H, correlation diagram to show the relationship between the MPA and ELISA data presented in C and D.

