FIGURE 6.
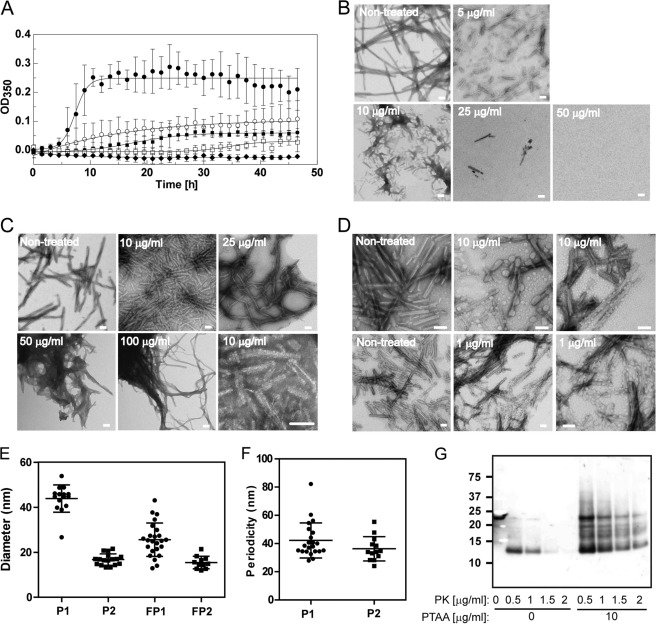
Effect of PTAA on mPrP(23–231) fiber formation and preformed fibers. A, time course of mPrP(23–231) fiber formation grown in the absence (filled circles) and presence of PTAA at different concentrations of 5 μg ml−1 (open circles), 10 μg ml−1 (filled squares), 25 μg ml−1 (open squares), and 50 μg ml−1 (filled diamonds) monitored by measuring the A350 over a period of 48 h. Error bars represent the S.D. of technical triplicate measurements. B, TEMs taken after 48 h of control fibers grown in the absence of PTAA and in the presence of different concentrations of PTAA. C, TEM of preformed mPrP(23–231) fibers incubated with different concentrations of PTAA. The electron micrograph in the lower right corner displays fibers incubated with 1 μg ml−1 PTAA at higher magnification. D, TEM of fibers recorded from another independent experiment grown in the presence of 10 μg ml−1 PTAA (upper panel) and of preformed mPrP(23–231) fibrils mixed with 1 μg ml−1 PTAA (lower panel). E, PTAA formed two different populations of small aggregates at concentrations between 1 and 10 μg ml−1 that were associated at the fibers with mean diameters of 43.9 ± 6.1 nm for population 1 (P1) and 16.8 ± 2.5 nm for population 2 (P2). Free aggregates had mean diameters of 25.6 ± 7.4 nm for population 1 (FP1) and 15.4 ± 2.7 nm for population 2 (FP2). Data are represented as the mean ± S.D. F, PTAA aggregates were located on the fibers in a highly periodic manner with distances of 42.2 ± 12.5 nm for population 1 and 36.3 ± 8.6 nm for population 2. Data are represented as the mean ± S.D. G, PTAA increases the resistance of mPrP(23–231) fibers to PK digestion. Aliquots of mPrP(23–231) fibers were incubated with 10 μg ml−1 PTAA prior to proteolysis with increasing concentrations of PK. The 1st lane contains nondigested mPrP(23–231) fibers. Scale bar, 100 nm.

