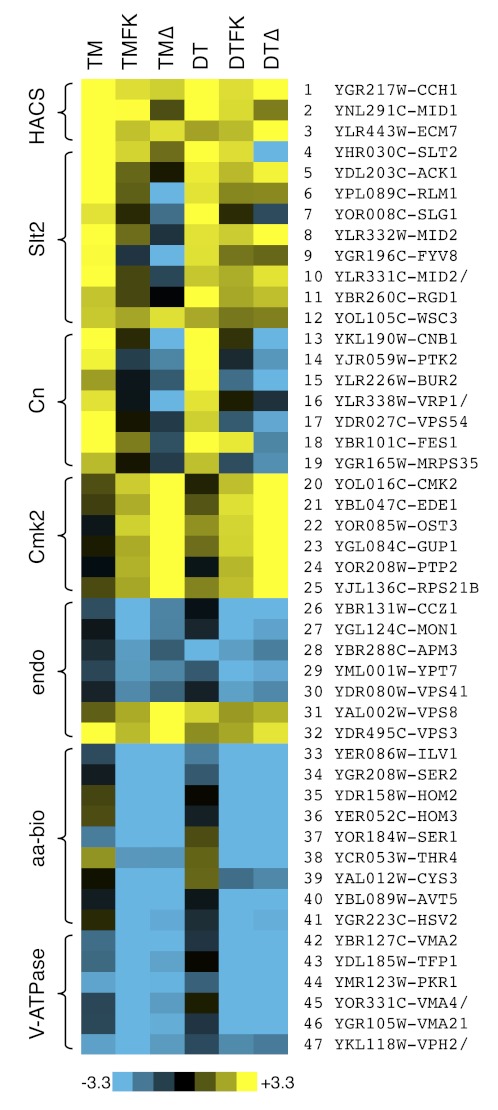
FIGURE 2.
Heat maps of cell death for selected mutants. Raw data from Fig. 1 and a secondary screen involving dithiothreitol (DT) instead of tunicamycin (TM) were converted to Z-scores as described under “Experimental Procedures,” and mutants with patterns of cell death similar to or opposite from those of HACS-, Cn-, and Cmk2-deficient cells are illustrated. The scale bar illustrates the number of standard deviations below (blue) or above (yellow) the population averages. TMΔ and DTΔ represent Z-scores of the FK506 responsiveness of each mutant strain.

