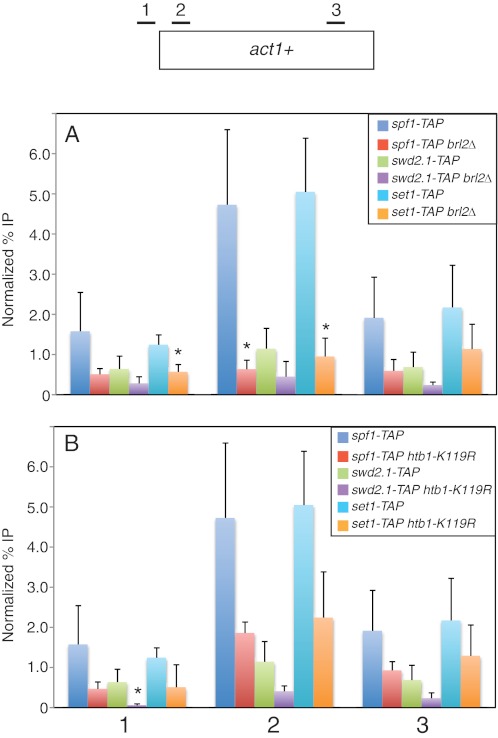
FIGURE 5.
ChIP analysis of Set1C subunits in wild-type and H2Bub1-deficient strains. A, ChIP was carried out in the indicated TAP-tagged strains (JTB241, JTB416, JTB450, JTB454, JTB242, and JTB405) and analyzed by quantitative PCR as described under “Experimental Procedures.” Positions of primer pairs are diagrammed at the top. ChIP signals are expressed as a percentage of the input signal for each primer pair. Normalization was carried out by subtracting the background percentage obtained from an untagged strain. Error bars denote S.D. from at least three independent experiments. *, mutant values that are significantly different from wild-type values (p < 0.05; unpaired t test). B, same as described for A for the indicated TAP-tagged strains (JTB241, JTB253-3, JTB450, JTB478, JTB242, and JTB404).

