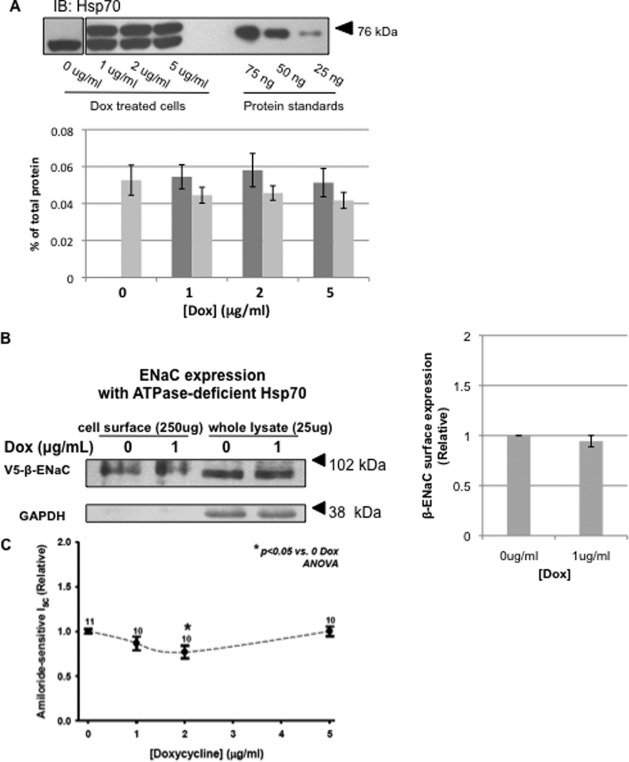
FIGURE 5.
Influence of ATPase-deficient Hsp70 on ENaC functional expression. MDCK cells with inducible expression of ATPase-deficient Hsp70-Myc/His were treated with indicated concentrations of Dox for 24 h. A, representative immunoblot (IB) showing the endogenous Hsp70 (lower bands) and induced ATPase-deficient Hsp70-Myc/His (upper bands) proteins. These panels are from the same immunoblot; however, intervening sample lanes were removed. The graph depicts densitometric analysis of three independent experiments. Light gray bars represent endogenous Hsp70, whereas dark gray bars indicate Myc/His-tagged ATPase-deficient Hsp70. The error bars indicate S.E. B, representative surface biotinylation experiment of cells with inducible overexpression of ATPase-deficient Hsp70 (of n = 3 independent experiments). Immunoblots for β-ENaC (using an antibody to the V5 epitope tag) of whole cell lysates and NeutrAvidin precipitated proteins are shown. Immunoblots for GAPDH were used as a control for protein loading (whole cell lysates) and to ensure that the membrane-impermeant biotin did not label intracellular proteins (NeutrAvidin precipitates). C, cells with inducible ATPase-deficient Hsp70 expression were grown as epithelial monolayers on semi-permeable supports. After 24 h in the presence of indicated concentrations of Dox, amiloride-sensitive Isc was determined using Ussing chambers and is expressed relative to samples incubated without Dox. The means ± S.E. for n replicates are indicated. Statistical significance was determined by ANOVA.

