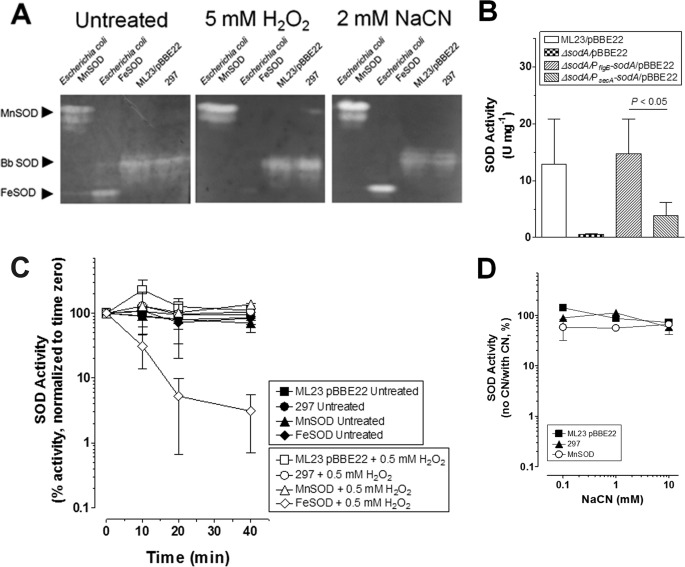
FIGURE 1.
B. burgdorferi SOD activity is H2O2- and cyanide-resistant. A, cell-free extracts (400 μg) from ML23/pBBE22 (third lane) and 297 (fourth lane) were subjected to native PAGE followed by staining for SOD activity. Separate gels were left untreated or treated with 5 mm H2O2 or 2 mm NaCN for 1 h prior to and during staining to determine inhibition of SOD activity. Mn-SOD (first lane, 10 units) and Fe-Sod (second lane, 10 units) from E. coli were included as a controls. B, cell-free extracts from ML23/pBBE22 and derivatives were assayed for SOD activity by detecting the SOD-inhibited reduction of cytochrome c by X/XO. C, cell-free extracts from 297 and ML23/pBBE22 were assayed for H2O2-inhibitable SOD activity by detecting the SOD-inhibited reduction of nitro blue tetrazolium by X/XO. The samples were either left untreated or treated with 0.5 mm H2O2. The percentage of activity is shown compared with activity at time 0. Fe-SOD (H2O2-inhibited) and Mn-SOD (H2O2-resistant) from E. coli are shown as controls. Less than 2.5 μm of H2O2 was introduced into the assay for treated samples. D, cell-free extracts from 297 and ML23/pBBE22 were assayed for SOD activity that is inhibited by NaCN by detecting the SOD-inhibited reduction of nitro blue tetrazolium by X/XO. NaCN was included in the assay. The percentage of activity is shown compared with no NaCN addition. Mn-SOD (NaCN-resistant) from E. coli is shown as a control. The data shown in A are representative from separate experiments. The data in B and C are from separate biological samples prepared collected at different times (n = 3). A paired Student's t test was used to determine significance (p < 0.05).

