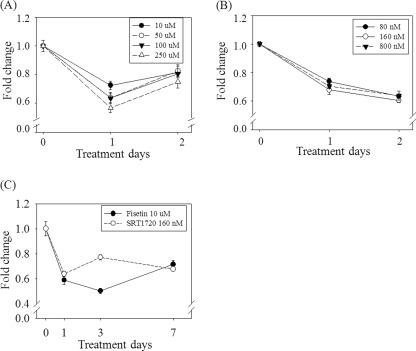
FIGURE 5.
Mitochondrial content in the cells treated with fisetin or SRT1720. A and B, cells cultured for 1 or 2 days in the medium supplemented either with 10, 50, 100, or 250 μm fisetin (A) or 80, 160, of 800 nm SRT1720 (B) were fixed and stained with MitoTracker Green and applied to flow cytometric quantification of mitochondria. C, mitochondrial contents in the cells treated with either 10 μm fisetin or 160 nm SRT1720 for 1, 3, or 7 days were measured. The fluorescence values relative to those in the 0 day control cells were averaged from two biological repeats and plotted. (All the points are of p < 0.01 compared with the 0 day control cells (−) by ANOVA test.)

